One finance screen. Five design systems.
Describe the screen. Switch the system. Export code that runs.
No brief yet? Start from a template


Salt DSOpen Sans, 4px corners, steel blue
uoauiInter, 12px corners, violet
Salt DS on the left, uoaui on the right. What differs: Open Sans against Inter, 4px corners against 12px corners, steel blue against violet.
The layout holds. The system changes.
The same search field and the same report card, whole, on each system's own surface. The corners, the typeface and the accent come from that system's components and tokens. The content stays where you put it.

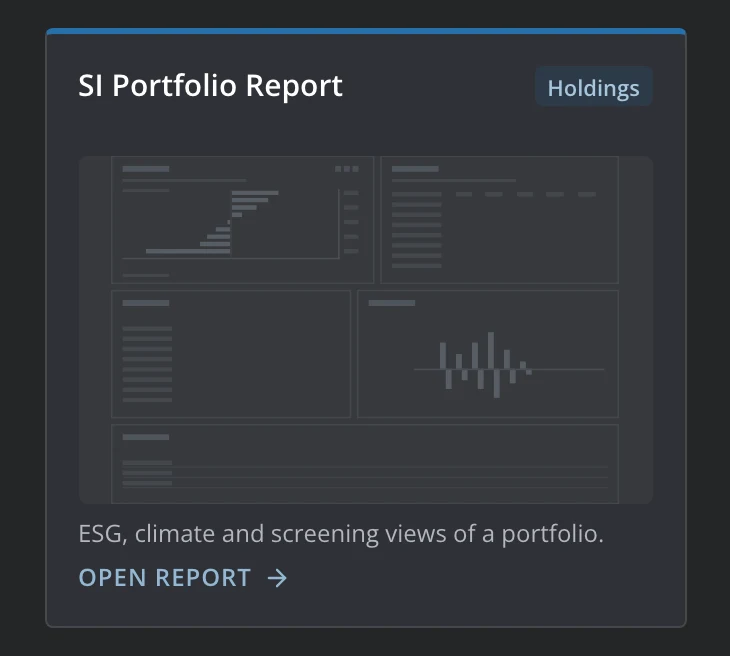 Salt DSOpen Sans. 4px corners. steel blueBuild in Salt DS
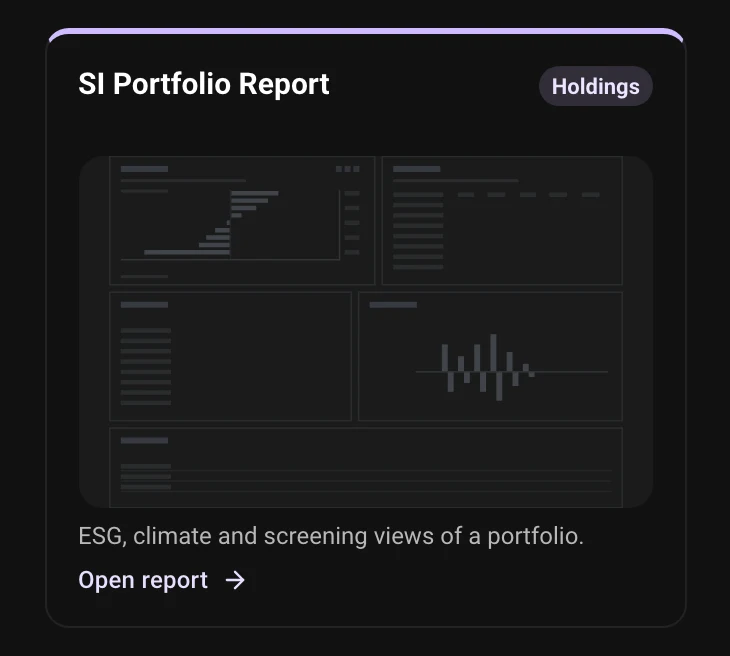 Material 3Roboto. 12px corners, pill buttons. lilacBuild in Material 3
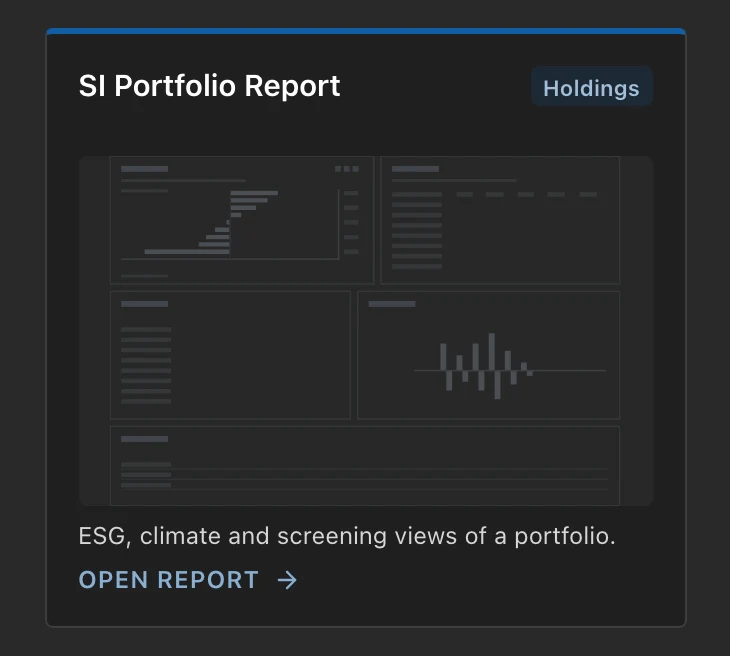 Fluent 2Segoe UI. 4px corners. deep blueBuild in Fluent 2
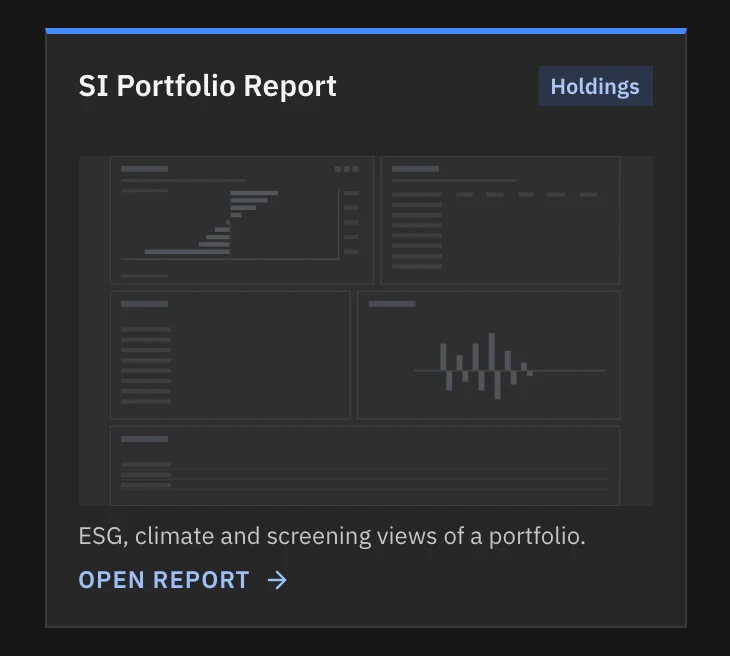 CarbonIBM Plex Sans. Square corners. bright blueBuild in Carbon
 uoauiInter. 12px corners. violetBuild in uoaui
Swipe sideways for all five.
From one sentence to a finished screen.
The canvas is built from real components, so what you edit is what you present and what you export. Pick a chapter to watch it happen.
Type what the screen is for, or start from one of 13 finance templates: risk, performance, ESG, climate, screening, FX execution and more.
Select any block and tell the chat what to change. Drag components in from the library and resize them on the grid. Reordering and resizing work from the keyboard too.
Switch design system, light or dark, and desktop, tablet or phone without rebuilding. Share the canvas as a link.
Leave with code, not a screenshot.
Six formats: React, a Vite project, HTML, design tokens, and two kinds of SVG, one of them measured for Figma. Shown here: the opening lines of two of the six, exactly as the builder wrote them.
We ran the Vite export of this screen: it installed, passed the TypeScript check and built.
import React from "react";
import "./styles.css";
import { Dropdown, FormField, FormFieldLabel, NavigationItem, Option } from "@salt-ds/core";
import { GridItem, GridLayout, StackLayout } from "@salt-ds/core";
import { SaltProvider } from "@salt-ds/core";
import "@salt-ds/theme/index.css";

export default function Dashboard() {
  return (
    <SaltProvider mode="dark" density="medium">
    <div className="dashboard-layout" data-mode="dark" data-density="medium">
      <a className="skip-link" href="#main-content">Skip to main content</a>
      {/* Header */}
      <header className="zone-header" data-layout="ds" data-tone="dark" data-flush="true">
        <StackLayout gap={0}><div className="topnav" data-tone="dark">
  <div className="topnav-brand">
    <span className="topnav-mark" aria-hidden="true">M</span>
    <span className="topnav-name">Meridian Analytics</span>
  </div>
  <span className="topnav-divider" aria-hidden="true"></span>
Lines 1 to 20 of 128
Start with one sentence.
Pick the system, describe the screen, and the builder opens with both.